
 Sep 9, 2026
Technical vs. Fundamental Analysis: Which Approach Fits You?
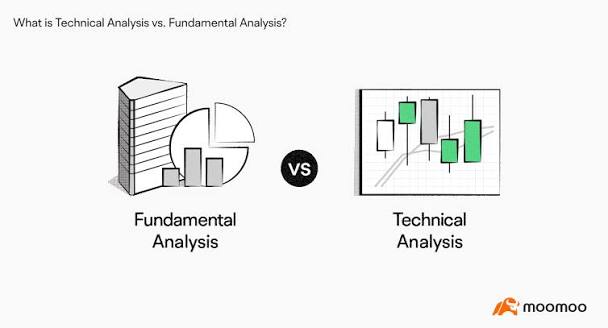
Every investor eventually faces a choice about how to evaluate stocks, and most approaches fall into one of two schools of thought: technical analysis and fundamental analysis. Technical analysis focuses on price charts, trading volume, and historical patterns, working from the assumption that past price behavior can help anticipate future movements. Fundamental analysis, by contrast, looks at a company's underlying financial health, examining balance sheets, income statements, cash flow, and broader sector conditions to estimate a stock's true value. Technical traders on the ISX often watch daily price ranges, moving averages, and volume spikes to identify potential entry and exit points for short-term trades. Fundamental investors, meanwhile, are more likely to study a company's dividend history, P/E ratio, and earnings trends before committing capital for the long term. Neither approach is inherently superior; the right choice often depends on your investment horizon, risk tolerance, and the amount of time you can dedicate to monitoring the market. Short-term traders who plan to hold a position for days or weeks tend to lean more heavily on technical signals, since fundamentals rarely shift meaningfully over such short periods. Long-term investors building a retirement or wealth-building portfolio typically prioritize fundamentals, since a company's earnings power and dividend reliability matter more over multi-year horizons. On the Iraq Stock Exchange specifically, banking and telecommunications stocks are frequently analyzed fundamentally due to their consistent dividend payouts and relatively stable earnings profiles. Technical analysis can still be useful even for long-term investors, particularly when deciding on the timing of an entry point rather than the decision to invest at all. A key technical concept is support and resistance: price levels where a stock has historically struggled to fall below or rise above, which traders use to set target entry and exit prices. Moving averages, which smooth out price data over a chosen period, help technical traders filter out short-term noise and identify the broader trend direction. On the fundamental side, the price-to-earnings (P/E) ratio remains one of the most widely used metrics, comparing a company's share price to its earnings per share to gauge relative valuation. Dividend yield is another critical fundamental metric, especially relevant on the ISX where several banks and telecom firms have historically offered yields between 6% and 12% annually. Fundamental investors should also examine a company's debt levels, since excessive leverage can amplify losses during economic downturns, particularly in cyclical sectors like industry and hotels. Sector context matters for both approaches: a technical breakout in a thinly traded stock may carry more risk than the same pattern in a heavily traded banking stock. Combining both approaches is common in practice. Many investors use fundamental analysis to decide which companies are worth owning, then use technical analysis to decide when to buy or sell. It's worth noting that technical analysis requires more frequent monitoring, since chart patterns can change daily, while fundamental analysis is typically reviewed on a quarterly or annual basis alongside financial disclosures. New investors on the ISX are encouraged to start with fundamental analysis, since it builds a stronger foundation for understanding what actually drives a company's long-term value. As comfort with the market grows, investors can gradually incorporate technical tools to refine entry and exit timing without abandoning their fundamental research process. Risk management remains essential regardless of approach: setting a maximum loss threshold before entering a position helps protect capital regardless of whether the decision was driven by charts or financial statements. Quarterly and annual disclosures, available through the ISX Disclosures section, are the primary data source for fundamental analysis and should be reviewed before any significant investment decision. Technical analysis tools, including charting platforms offered by licensed brokers, are typically included as part of standard trading platform access at no additional cost. Ultimately, the "right" approach is the one an investor can apply consistently and understands well enough to trust during periods of market volatility. This course has walked through the core differences between technical and fundamental analysis, key metrics used in each, and how ISX investors commonly blend the two approaches based on their investment timeline.